Contents
What is Spectroscopy ?
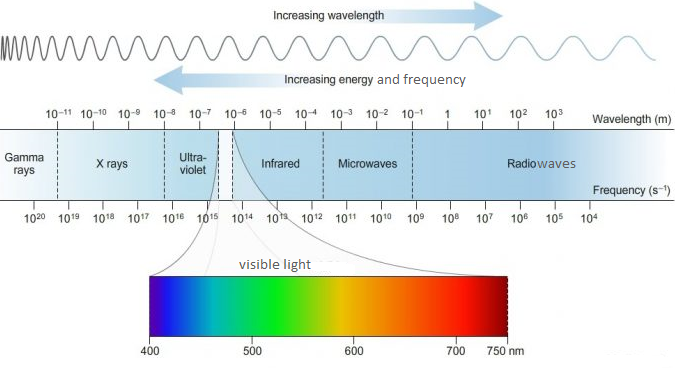
Spectroscopy is the study of the interaction (absorption, emission, and scattering) between electromagnetic radiation and matter.
The term “spectroscopy” defines a large number of techniques that use electromagnetic radiation to obtain information about the structure and properties of matter (atoms and molecules).
The electromagnetic radiation is passed onto a sample matter and the response is observed and recorded. A plot of the response as a function of wavelength is referred to as a spectrum.
Spectroscopy is the modern technique which has many merits (advantages) over the classical techniques.
- Accuracy of these techniques is very high as compared to classical techniques.
- These techniques are quick (i.e. not time consuming).
- There is no wastage of sample. The sample used in investigation remains unchanged and can be reused for other studies, except in case of mass spectrometry, where the sample is destroyed.
Types of spectroscopic techniques
- Spectroscopy methods can be categorized depending on the types of radiation and the interaction between the radiation with matter.
- On the basis of nature of the interaction between the energy and the material, spectroscopy is classified as absorption, emission and scattering spectroscopy.
- On the basis of radiation involved in the interaction, spectroscopy can be radiowave, microwave, infrared, ultraviolet-visible, x-ray, andgamma ray spectroscopy.
There are many different types of spectroscopy, but the most common types used for chemical analysis are as follows:
- Nuclear magnetic resonance (NMR) spectroscopy
- Infrared (IR) spectroscopy
- Mass spectrometry
- Ultraviolet and visible spectroscopy
- Atomic spectroscopy
- Raman spectroscopy

Nuclear magnetic resonance (NMR) spectroscopy
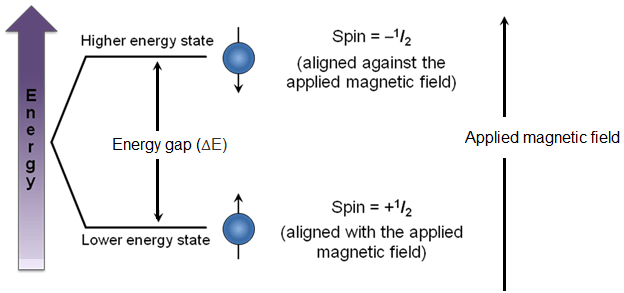
If a nucleus like proton is placed in an external magnetic field, the magnetic moment of proton will be oriented either with or against the external magnetic field.
Out of two orientations, the one aligned with applied field is more stable ( i.e. associated with smaller energy) than the one aligned against the applied field (i.e. associated with higher energy). The difference in energy of two orientations is denoted by ∆E. Thus, if we desire to flip the nucleus from lower energy state to higher energy state, an amount of ∆E will have to absorbed by the nucleus.
In organic chemistry, we are more interested in the protons as the nucleus, as hydrogen is constituent of almost every organic compound. The particular branch of NMR spectroscopy where the nucleus is proton is called proton magnetic resonance (PMR) spectroscopy.
A PMR spectrum can be recorded by placing the substance containing hydrogen nucleus in magnetic field of different strength and noting the magnetic field strength at which the absorption of energy corresponding to flipping of proton from lower to higher energy state takes place.

Information that can be obtained from NMR spectrum (spectroscopy):
The following informations regarding structure of the molecule can be obtained from NMR spectroscopy:
- The number of signal tells us how many different types of protons are present in molecule.
- The position of signal tells us about the electronic environment of proton (shielding and deshielding of protons).
- The intensities of signals tells us how many protons of each kind are present.
- The splitting of signal into several peaks tells us about the environment of a proton with respect to other nearby protons.
Equivalent and non-equivalent protons:
Equivalent protons: Protons having the same environment in a molecule absorb the same energy (magnetic field) and give one signal(peak) in the NMR spectrum, such protons are called equivalent protons.
Non-equivalent protons: Protons having the different environment in a molecule absorb the different energy (magnetic field) and give different signals(peaks) in the NMR spectrum, such protons are called non-equivalent protons.
From the number of signals, we can tell how many different types of protons are present in the molecule.
For example:

Shielding and deshielding of protons:
When a compound is placed in a magnetic field, the electrons around the protons also generate a magnetic field called “induced magnetic field”. The induced magnetic field either oppose or supports the applied magnetic field.
- If the induced field opposes the applied field, the effective field strength experienced by the protons decreases. The proton is said to be shielded in this case. The shielded proton absorbs upfield in NMR spectrum as a greater applied field strength is required for the excitation of protons to higher level.
- If the induced field supports(rainforces) the applied field, the effective field strength experienced by the protons increases. The proton is said to be deshielded in this case. The deshielded proton absorbs downfield in NMR spectrum as a lower applied field strength is sufficient for the excitation of protons to higher level.

As a result of shielding and deshielding of protons, there is a shift in the position of the NMR signal as compared with standard substance(i.e. TMS), which is called chemical shift.
Chemical shift:
The shift in the position of PMR signal compared with a standard substance (i.e. TMS) as a result of shielding and deshielding by electrons is known as chemical shift.
The commonly used scale for expressing the chemical shift is δ-scale(ppm). Tetramethylsilane(TMS) is taken as internal reference. The position of TMS signal is taken as 0 ppm. Next scale is τ and is given as τ=10- δ.

From the chemical shift, the electronic environment of proton can be determined. Protons with different environment (non equivalent protons) have different chemical shift values.
Chemical shift value also tells us about the type of proton i.e. aliphatic, aromatic, alcoholic, carboxylic, etc.
Q) Why do we choose tetramethylsilane i.e. (CH3)4Si as a standard substance for recording chemical shift?
Spin-spin coupling (Splitting of NMR signals) :
- Spin-spin coupling in NMR spectroscopy is the effect of one nucleus’s magnetic field on other nuclei within the molecule, causing splitting of the NMR signals.
- We assume that one type of protons give rise to one signal(peak) in PMR (NMR) spectrum but in actual practice it is not so. For example:
![]()
- This compound contains two types of protons, therefore we expect to observe two signals but actually five signals are observed.
- This phenomenon of splitting of a peak into several peaks is called splitting of signals.
- Splitting of signals is due to spin-spin coupling between the neighboring protons. This can be explained as:

- Consider the absorption by one of the proton ‘b’. Magnetic field produced by neighboring proton ‘a’ may have two possible orientations with respect to applied magnetic field.
Case I : The magnetic field produced by the proton is aligned with the applied magnetic field.
Case II : The magnetic field produced by the proton is aligned against the applied magnetic field.

In the first case, the proton ‘b’ experience some increased magnetic field strength and absorb at a lower applied field (downfield).
In the second case, the proton ‘b’ experience some decreased magnetic field strength and absorb at a higher applied field (upfield).
Thus, one peak will be split into two peaks (doublet).
- Now, consider the absorption by the proton ‘a’. Magnetic field produced by two neighboring protons ‘b’ may have three possible orientations with respect to applied magnetic field.
Case I : The magnetic field produced by two protons is aligned with the applied magnetic field.
Case II : The magnetic field produced by two protons is aligned against the applied magnetic field.
Case III : One proton is aligned with the applied field and the other proton is aligned against the applied magnetic field.
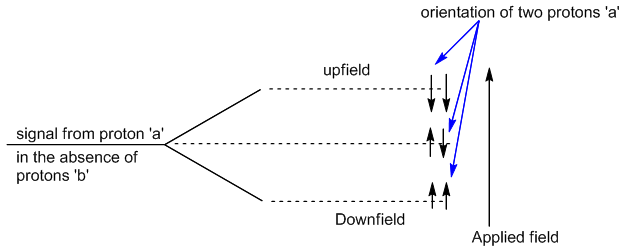
In the first case, the proton ‘a’ experience some increased magnetic field strength and absorb at a lower applied field (downfield).
In the second case, the proton ‘a’ experience some decreased magnetic field strength and absorb at a higher applied field (upfield).
In the third case, the position of the signal will not change.
Thus, one peak will be split into three peaks (triplet).
Mass spectrometry
- In mass spectrometry, the molecules are bombarded with a stream of high energy electrons. The energetic electrons knock out generally one most loosely bound electron from the molecule. This process produces molecular ions or radical cations.
- The molecular ions being energetic is further fragmented to produce smaller ions called daughter ions or fragmented ions.

Each ion has certain m/e ratio i.e. ratio of mass to charge of the ions.
These ions are accelerated by electric field and the ions with particular m/e ratio are detected and recorded by mass spectrometer.
A graph between relative abundance (intensity) and m/e values of the ions is called mass spectrum.

Applications of Mass Spectrometry:
Mass spectrometry is an efficient method to elucidate the chemical composition of a sample or molecule. More recently, it has been used to classify biological products, in particular proteins and protein complexes, in a number of species. Usually, mass spectrometers can be used to classify unknown substances by molecular weight measurement, to measure known compounds, and to determine the structure and chemical properties of molecules.
- Due to its capability to distinguish between substances, Mass spectrometry is used to determine unknown substances.
- To identify the isotopes of a substance.
- In analytical laboratories that study the chemical, physical and biological properties of substances. It is favored over several other analytical techniques as it has less background interference since it is performed in a vacuum.
Infrared (IR) spectroscopy or Vibrational spectroscopy
- IR spectroscopy detects the absorption of light by a compound, in the IR region of the electromagnetic spectrum.
- The molecular vibrations are of two types – (i) stretching and (ii) bending vibration. A stretching vibration causes change in the interatomic distance while the bending vibration causes the change in bond angle.
- On absorption of light(radiation), the molecules are excited from lower vibrational levels to higher ones.
- Molecules will absorb such frequencies as are needed to excite molecules from lower vibrational level to permitted higher energy levels.
- Every bond and every functional group has a specific absorption frequency to excite the molecule to higher vibrational level.
- A graph between the amount of absorbance (or transmittance) of IR light against the frequency (or wavelength) of this light is called infrared (IR) spectrum.
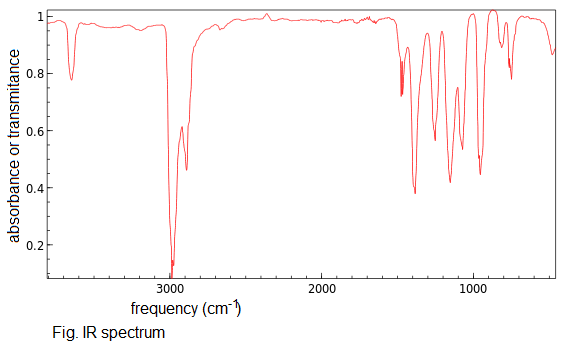
Functional group region and finger print region in IR spectrum:
- Two important areas (reasons) in a IR spectrum are the 4000-1450 cm-1 and 1450-500 cm-1
- The higher frequency region (4000-1450 cm-1) is called functional group region and the lower frequency region (1450-500 cm-1) is called finger print region.
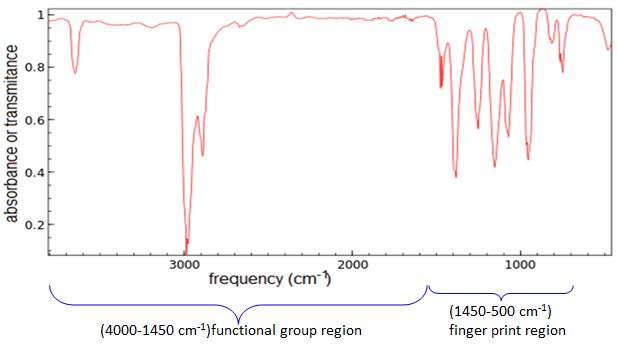
- In the fingerprint region, the spectra usually consist of bending vibrations within the molecule.The pattern of peaks is more complicated. The fingerprint region is important because each different compound produces its own unique pattern of peaks (like a fingerprint) in this region.
- In the functional group region, the spectra usually consist of stretching vibrations within the molecule. This region contains relatively few peaks. For example:
- The peak (band) at 3200-3600 cm-1 is due to O-H bond stretching of alcohols and phenols.
- The peak (band) at 1690-1760 cm-1 is due to C=O bond stretching of aldehydes, ketones, carboxylic acids and esters.
Applications of IR-spectroscopy:
Infrared spectroscopy is widely used in industry as well as in research. It is a simple and reliable technique for measurement, quality control and dynamic measurement. It is also employed in forensic analysis in civil and criminal analysis.
Some of the major applications of IR spectroscopy are as follows:
1. Identification of functional group and structure elucidation:
Entire IR region is divided into group frequency region and fingerprint region. Range of group frequency is 4000-1500 cm-1 while that of finger print region is 1500-400 cm-1.
In group frequency region, the peaks corresponding to different functional groups can be observed. According to corresponding peaks, functional group can be determined.
Each atom of the molecule is connected by bond and each bond requires different IR region so characteristic peaks are observed. This region of IR spectrum is called as finger print region of the molecule. It can be determined by characteristic peaks.
2. Identification of substances:
IR spectroscopy is used to establish whether a given sample of an organic substance is identical with another or not. This is because large number of absorption bands is observed in the IR spectra of organic molecules and the probability that any two compounds will produce identical spectra is almost zero. So if two compounds have identical IR spectra then both of them must be samples of the same substances.
IR spectra of two enatiomeric compound are identical. So IR spectroscopy fails to distinguish between enantiomers.
For example, an IR spectrum of benzaldehyde is observed as follows.
C-H stretching of aromatic ring-3080 cm-1
C-H stretching of aldehyde-2860 cm-1 and 2775 cm-1
C=O stretching of an aromatic aldehyde-1700 cm-1
C=C stretching of an aromatic ring-1595 cm-1
C-H bending-745 cm-1 and 685 cm-1
No other compound than benzaldehyde produces same IR spectra as shown above.
3. Studying the progress of the reaction
Progress of chemical reaction can be determined by examining the small portion of the reaction mixture withdrawn from time to time. The rate of disappearance of a characteristic absorption band of the reactant group and/or the rate of appearance of the characteristic absorption band of the product group due to formation of product is observed.
4. Detection of impurities
IR spectrum of the test sample to be determined is compared with the standard compound. If any additional peaks are observed in the IR spectrum, then it is due to impurities present in the compound.
UV – Visible spectroscopy or electronic spectroscopy
- The Principle of UV-Visible Spectroscopy is based on the absorption of ultraviolet light or visible light by chemical compounds. When the matter absorbs the light, it undergoes excitation and de-excitation, resulting in the production of a spectrum.
- When matter absorbs ultraviolet radiation, the electrons present in it undergo excitation. This causes them to jump from a ground state (an energy state with a relatively small amount of energy associated with it) to an excited state (an energy state with a relatively large amount of energy associated with it).
- It is important to note that the molecule does not absorb just any radiation. It absorbs only that radiation which possess appropriate energy required to electronic transition.
- The absorption of radiation is observed (detected) with the help of spectrophotometer.
- The graph between the amount of radiation absorbed by the sample(absorbance) and the wavelength of the radiation is called absorption spectrum.

Different types of electronic transitions:
When a molecule absorbs the radiations, the electrons are excited to higher levels. The electrons involved could be σ electron (occupying σ molecular orbital) or π electron (occupying π molecular orbital) or n electron (non-bonding). In the diagram below, σ, π and n electrons have been indicated in a molecule of aldehyde (RCHO).


Allowed and forbidden transitioins:
Molecules absorb only such radiations which have appropriate energy to excite the electrons to allowed higher level. The probability of a particular electronic transition has found to depend upon the value of extinction coefficient (€) and certain other factors. According to these factors, transitions can be divided into two categories:
(i) Allowed transitions
(ii) Forbidden transitions
(i) Allowed transitions – These are the transitions having extinction coefficient(€)= 104 or more. π→ π* transitions fulfill these requirements.
For example, in 1,3-butadiene which shows absorption at 217nm has € value 21000 represents an allowed transition.
(ii) Forbidden transitions – These are the transitions having extinction coefficient(€) less than 104 . n→ π* transitions are forbidden transitions.
For example, transition of saturated aldehydes which shows weak absorption near 290nm has € value 100 represents a forbidden transition.
Chromophore and Auxochrome :
Chromophore:
The chromophore was previously defined as a functional group which gives (imparts) the colour to the compound. For example- nitro group is a chromophore because its presence in a compound gives yellow colour to the compound. But these days the term chromophore is defined as any group which absorbs electromagnetic radiation in a visible or UV region, which may or may not impart any colour to the compound.
Some of the important chromophores are :

Auxochrome :
It is a group which itself does not act as a chromophore but when attached to a chromophore, it shifts the absorption towards longer wavelength along with an increase in the intensity of absorption.
Some commonly known auxochromic groups are: -OH, -NH2, -OR, -NHR, and –NR2. For example: When the auxochrome –NH2 group is attached to benzene ring, its absorption changes from λmax=225 nm (ɛmax 203) to λmax=280 (εmax1430)
All auxochromes have one or more non-bonding pairs of electrons. If an auxochrome is attached to a chromophore, it helps in extending the conjugation by sharing of non-bonding pair of electrons as shown below.

Bathochromic and Hypsochromic shift:
Bathochromic or red shift:
Shift of an absorption of light towards higher wavelength (lower energy) or towards red portion of spectrum is known as bathochromic shift or red shift.
This effect may be produced by changing the polarity of solvent. It is also produced if two or more chromophores are present in conjugation.
For example, 1,3-butadiene shows absorption at 217nm.
Hypsochromic or blue shift:
Shift of an absorption of light towards lower wavelength (higher energy) or towards blue portion of spectrum is known as hypsochromic shift or blue shift.
This effect may be produced by the removal of conjugation (auxochrome) or by changing the polarity of solvent.
For example, protonation of aniline causes a blue shift from 280 nm to 203 nm because the aniline ion formed by protonation has no electron pair(i.e. conjugation is removed).
Hyperchromic and Hypochromic effect:
Increase in intensity of absorption is called hyperchromic effect while the decrease in intensity of absorption is called hypochromic shift.
Introduction of auxochromes (conjugation) into the system causes hyperchromic effect and removal of conjugation causes hypochromic effect.